How to Estimate Risk in Medical Devices According to ISO 14971


TL;DR
If you're building a medical device, ISO 14971 is your blueprint for making sure it’s safe, and not just “we hope it doesn’t explode” safe. It's a structured way to think through what could go wrong, how bad that would be, how likely it is to happen, and how you can put controls in place so the worst doesn’t happen. In essence, risk management requires you to determine foreseeable risks (severity and probability) of your medical device and then build in risk controls to reduce those risks as far as possible so that they are acceptable.
In this blog post, we will dive into how to estimate risk, including the crucial (and surprising) first step of imagining your device without any of its fancy safety features. If you're building a medical device, this is your straightforward guide to understanding part of its most critical process. If you missed our last blog on intro to ISO 14971, you can find it here.
Contents
- The Risk Equation: Severity x Probability
- Acceptable or Unacceptable?: The Risk Matrix
- The "Bare Bones" Rule: Pretend the Safety Features Don’t Exist
- Estimating probability: P1 x P2
- How to Get Those Numbers
- Pro Tips for Smarter Risk Estimation
- Conclusion
The Risk Equation: Severity x Probability
Where we left off last time was we had created a Harms Table and were needing to determine just how often those risks occur and how serious they are if they do happen. At its core, ISO 14971 defines risk estimation as:
Risk Estimation = Probability of Occurrence of Harm (P) × Severity of that Harm (S)
- Severity (S) is how bad the outcome is, from mild skin rash to something far more serious. Defining this scale properly is the first step in understanding what you’re up against.
- Probability (P) is how likely that outcome is to happen, not just that something goes wrong, but that it actually causes harm. This part is often tricky and where much of the detailed analytical work lies. Think through a chain of events to determine how likely a bad outcome really is.
Still feel like there are too many ways of defining probability and severity? In medical devices, there are a few best practices you can use. For that, let’s talk about the risk matrix.
Acceptable or Unacceptable?: The Risk Matrix
To represent each Severity or Probability, we use numbers and scales, typically from 1-5, to rate them. For instance, if something has a greater than 0.01% chance of happening, it might get a 5 on the scale. Less than one in 100,000? That's more like a 3.
In order to arrive at these values for your device and for how you’ll use your scales S1->S5 and P1->P5, you should bring in some experts to help you determine what is expected for each given the clinical environment and intended use of the product. For probability, you can ask yourself “would this happen 1 in 100 times of use or 1 in 1,000,000 times?”. This can give you two different P values.
For severity, for example, you will often see scales like the following:
- S1 = Negligible, Results in slight inconvenience or discomfort.
- S2 = Minor, Results in temporary injury or impairment not requiring medical or surgical intervention
- S3 = Serious, Results in reversible injury or impairment requiring medical or surgical intervention
- S4 = Critical, Results in permanent impairment or irreversible injury
- S5 = Catastrophic, Results in death
The Severity scores and Probability scores are then plotted across a grid with severity on one axis and probability on the other called a risk matrix or risk acceptance matrix.
Where your risk falls on this grid according to its probability and severity will land it into one of three categories
- Acceptable, Low Risks - Usually colored green
- Tolerable, Medium Risks - Usually colored yellow
- Unacceptable, High Risks - Usually colored Red
It's like a heatmap for risks. Remember, we are asked to reduce risks as far as possible, even low risks! However, your goal is to get our risk levels into the Acceptable green range.
How do we do that? Read our next blog on creating risk controls to find out.
The "Bare Bones" Rule: Pretend the Safety Features Don’t Exist
To do right by your risk assessment, you need to get in the right mindspace to perform a risk assessment. Often, the best and most comprehensive way to estimate risk is to apply what is called the “Bare Bones” rule.
For this, you assume that no safety features or fallback mechanisms exist in your product when you are running through possible scenarios. Imagine your product with no instructions, no alarms, no cybersecurity protections, just the core device. It might sound weird but here is the reason why:
- It makes you own every risk your device might cause before mitigation.
- It shows how valuable your safety features really are by proving how much they reduce risk.
- It future-proofs your decisions, documenting why something was added helps ensure it’s not quietly removed later by someone trying to cut costs.
Also, in these cases, you will want to consider worst case scenarios as well. Regulators want to be sure that you considered that if something could go terribly wrong, you’ve considered it.
Estimating Probability: P1 x P2
The ISO standard dictates:“The probability of occurrence of harm can be expressed as a combination of separate probabilities (P1, P2) or as a single probability (P). A decomposition into P1 and P2 is not mandatory.”
However, we find that splitting up a probability into two makes the final probability more accurate and often easier to estimate. So we split the probability into two parts: P = P1 × P2
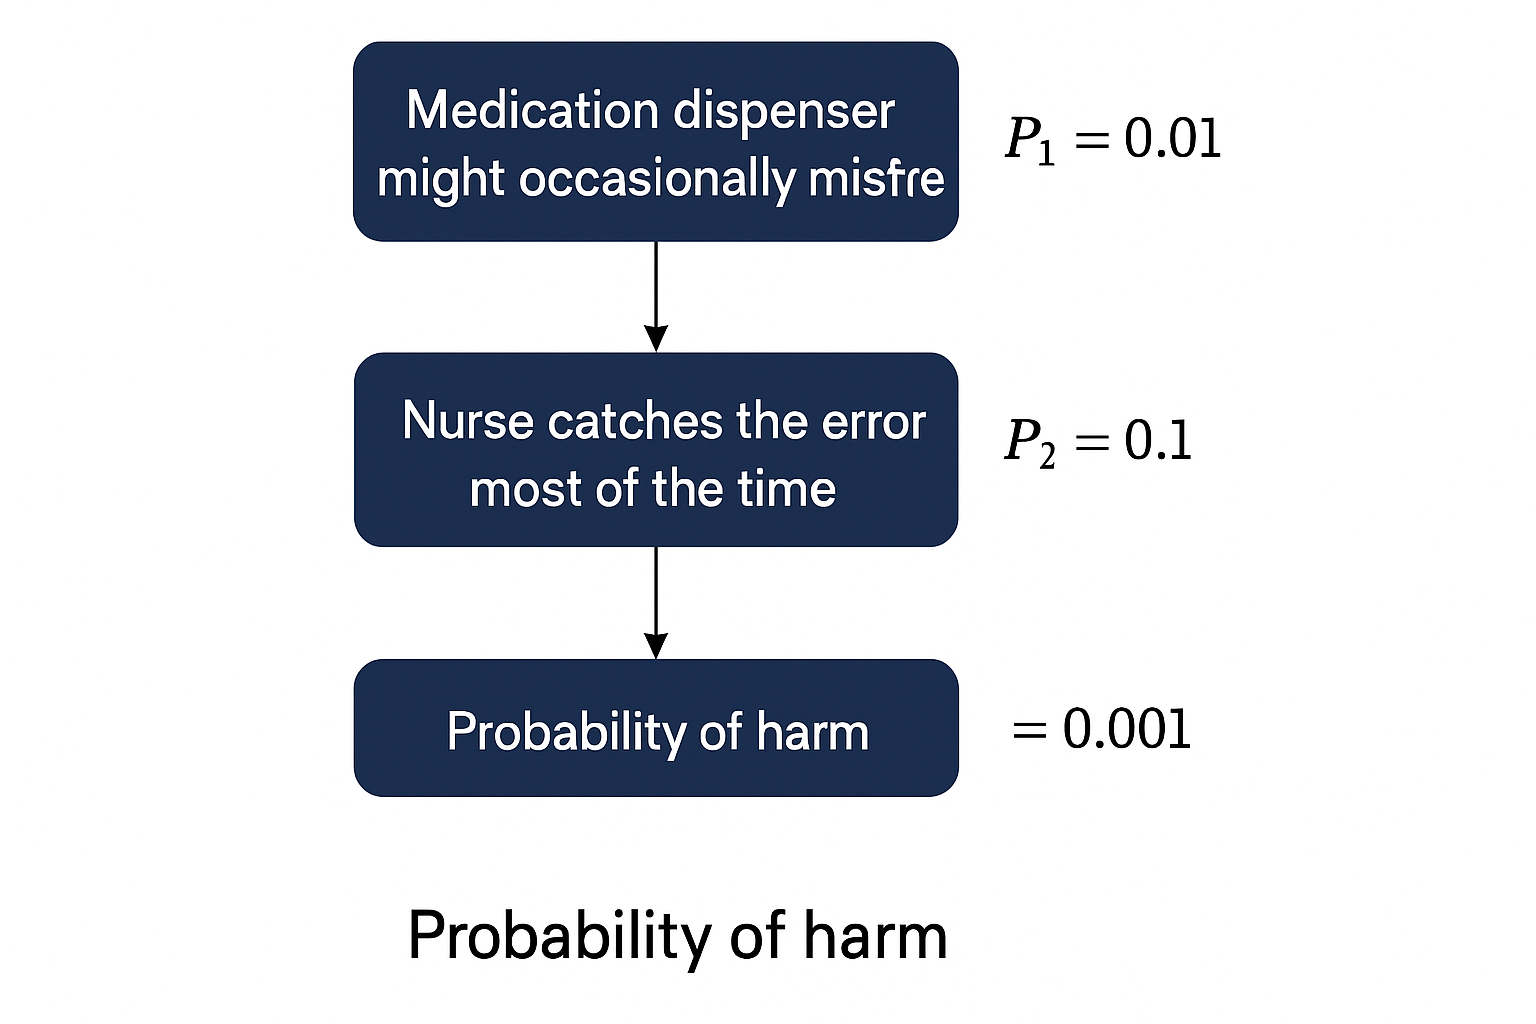
- P1: How likely is it that the hazardous situation happens?
- P2: If it does happen, how likely is it to cause actual harm?
Example:A medication dispenser might occasionally misfire (P1 = 0.01), but maybe a nurse catches the error most of the time (P2 = 0.1). → P = 0.01 × 0.1 = 0.001 (a 0.1% chance of actual harm per use).
How to Get Those Numbers
Are you making up numbers for your severity and probabilities? No, they are not fabricated. However, yes, they are your best guess.
You should be making educated, evidence based guesses through relevant data and using external or internal experts. Consider:
- Clinical experts like MDs or relevant professionals
- Published data from similar devices or research
- Statistical data from post-market sources like FDA’s MAUDE
- Lab testing like stress, fatigue, or usability tests
- Engineering analysis (e.g., Fault Tree Analysis, Monte Carlo simulations)
If you’re a startup and your product is totally novel, expert judgment might be your only option at first. That’s okay.
When considering how you get the numbers for your risks, splitting up the probabilities has an added benefit. Think about the following:
- P1 can be estimated using objective data like component failure rates, manufacturing data, or results from usability studies.
- P2 can be estimated using clinical data, scientific literature, or input from medical experts.
By separating the technical probability (P1) from the clinical probability (P2), you can use the best data for each part, leading to a more realistic overall risk estimate. It also sets you up to be more precise in administering your risk controls.
For example, maybe your risk controls will only reduce P1 or P2 and that way it makes it easier to recalculate your residual risk following mitigation. This last sentence not make much sense to you? No worries, we have a follow up blog on Risk Controls that you will want to read that will make all clear!
Pro Tips for Smarter Risk Estimation
- Use the "bare bones" view first: No cheating with controls in your initial estimate.
- Agree on units: Make sure your team knows whether you're measuring risk per use, per device, or per year.
- Focus on the end harm: Don’t just stop at “the battery might fail.” Ask, “What happens to the patient if it does?”
- Check your controls: If a user manual warning somehow reduces risk more than a physical lockout, something’s off.
Conclusion
Identifying risks is only half the battle when it comes to creating a robust risk management file. ISO 14971 helps you build safer devices and compliant regulatory submissions, but only when used properly. Use the correct data to put together risk probabilities and severities and lean on experts to ensure that they are clinically relevant. Split your probabilities for even more accurate information.
It is really important to consider all the likely risks your product will cause your users. You will eventually need to update your risks down the road if any new risks are identified which can be hassle.
Now that we have our risk table created with our harms and severities, it’s time to talk about risk acceptability and risk controls. Learn more about this in our next blog on Risk Controls.